We know how to analyze data by analyzing the statistics of the data and we’ve learned how to manipulate the data. But is statistics enough to analyze the data? Short answer, Visualization of data is necessary in order to find details that we missed that’s why Matplotlib Python is the best library to visualize data using Python. All that can be done using a python library called Matplotlib.
It’s recommended that you know about Pandas. If not you can learn about it here.
Why Visualize the Data?
Until now we’ve analyzed our data based solely on whatever the descriptive statistics that pandas showed us. But statistics could be very misleading take Anscombe’s Quartets for example. In Anscombe’s Quartets, we have 4 datasets with the same descriptive statistics, but when visualized we could see that all the datasets were anything but similar.
That is why descriptive statistics should only be a step of the analysis pipeline and not the pipeline itself.
Plots in Matplotlib Python
Matplotlib is a data visualization library in Python. The pyplot, a sublibrary of matplotlib, is a collection of functions that helps in creating a variety of charts. Using matplotlib you can plot various plots very easily. Let’s take a look at various plots that it has to offer:-
- Line Plot
- Scatter Plot
- Histogram
- Bar Plot
- Pie Chart
- Box Plot
We’ll see how you can create them in this tutorial. For this tutorial, we’ll be using the Housing Price Dataset on Kaggle. For simplicity, I’ll remove every column with a NaN value.
df = pd.read_csv('data.csv')
df.dropna(axis = 1,inplace = True)
df.head()
Importing Matplotlib
Conventionally, we don’t import matplotlib as a whole instead we import a subclass called pyplot, as plt, along with an optional magic expression.
import matplotlib.pyplot as plt
%matplotlib inline
%matplotlib notebook: It will display interactive plots within the notebook.
%matplotlib inline: It’ll display static images in the notebook.
Plotting Data using Matplotlib
Line Plot
Line plots are used to represent the relation between two data X and Y on a different axis. So basically a line plot is a plot where points are connected via points. We can create them using plt.plot().

It assumes the values of the x-axis to start from zero going up to as many items in the data.
Scatter Plot
A Scatter plot is a plot that is used to represent the relation between 2 features. You can create them using plt.scatter().

And as you can see we created a scatter plot above with the x-axis a the column 2ndFlrSF and the y-axis column SalePrice. And as seen in the graph we can say that the more the value of 2ndFlrSF more the value of SalePrice. But there are houses that don’t have the 2nd floor that’s why there are so many points on x = 0.
Histogram
A histogram is used to visualize frequency distributions. The bars in the histogram represent the frequency of the variable in a particular range, the size of this range is determined by bin size. You can set bin size manually by passing it as a value for the bins argument. You can create them using plt.hist().
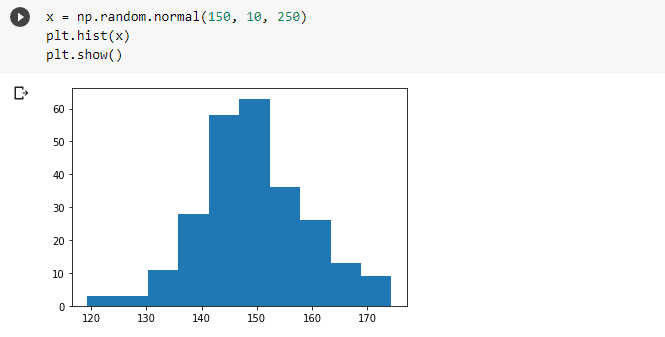
You can either manually find bin size or you can use formulas like Sturge’s rule, Rice’s rule, etc. to find it.
Bar Plot
A bar plot presents categorical data with bars with lengths proportional to the values that they represent. You can create them using plt.bar().

The histogram presents numerical data whereas the bar graph shows categorical data. The histogram is drawn in such a way that there is no gap between the bars.
Box Plot
Boxplot is used to visualize the 5-number summary of a distribution. Box plots can show outliers which are displayed as a circle. You can create them using plt.boxplot().

- The red line is the median.
- The lowest line is the minimum non-outlier value.
- The highest line is the maximum non-outlier value.
- The highest line of the box is the 3rd quartile value.
- The lowest line of the box is the 1st quartile value.
Pie chart
A Pie Chart is a circular statistical plot that can display only one series of data. Matplotlib has pie() function in its pyplot module which creates a pie chart representing the data in an array.

Customize the Plot
Adding Label Axis
Until now, our x and y-axis were empty which made it difficult to determine which axis represented what. Since labeling is necessary for understanding the chart dimensions, we will see how to add labels to the plot. In order to set labels, we can pass them as arguments in xlabel() and ylabel().

Adding Title of the Plot
While working with plots it becomes essential to tell what plot represents what. This can be done by adding a Title to the graph to be shown above. We can do that by bypassing the title as an argument to plt.title()

Adjusting Plot Size
After visualizing for some time now you might have found out that regardless of the amount the size of the plot is the same. But you can adjust the plot size by passing the tuple i.e. the shape of the plot as an argument to plt.figure().

Plotting 2 Plots in One
In matplotlib, you can create 2 scatter plots in one by simply adding code for another one.

Adjusting Opacity of the Dots
The plot above has orange points overlapping the blue points. We can adjust the opacity of the dots by changing the value of the alpha argument. By default, alpha is 1. Hence lesser the alpha value the lesser the opacity.
Adding Legend
If we were to show someone the above plot it’ll be hard to determine what dot color represented which variable. In order to tackle this, we can add the label for each plot to be displayed in the legend using plt.legend().

Making Subplots
We have seen how we can create 2 scatter plots in the same plot. But we can actually create them separately as 2 separate subplots. We can create subplots By using plt.subplot2grid(), which takes 2 tuples of the grid size and coordinates the particular plot. For Eg: The following subplots are made in 1 row 2 column grid at (0,0) and (0,1) coordinates. We can also specify the span of the plot using rowspan and colspan arguments.
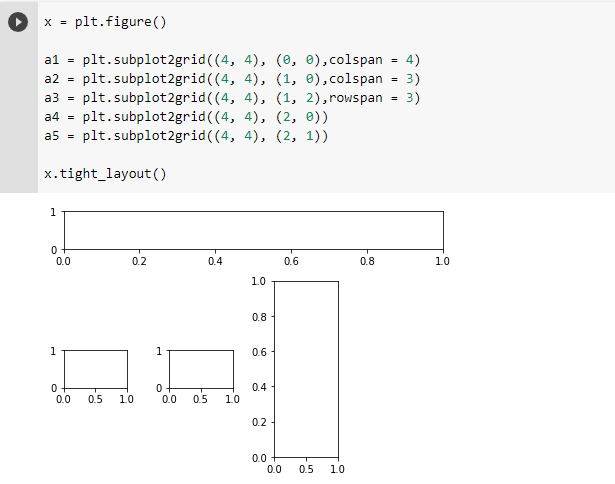
We can assign a1 and a2 the corresponding plots they have to display along with their respective customization.
Matplotlib is a great tool for visualization but as the plot grows more complex it becomes harder to plot, along with it there are many plots not supported by matplotlib. To solve this we can use a library called seaborn. We’ll talk about this library in the next article.
Thanks for reading the Matplotlib Python article, hope you enjoyed and learned enough from it. But, still, if you found any problems, let us know in the comments.
If you found something wrong in this article, please let us know.
Also read:
- Flower classification using CNNYou know how machine learning is developing and emerging daily to provide efficient and hurdle-free solutions to day-to-day problems. It covers all possible solutions, from building recommendation systems to predicting something. In this article, we are discussing one such machine-learning classification application i.e. Flower classification using CNN. We all come across a number of flowers…
- Music Recommendation System in Machine LearningIn this article, we are discussing a music recommendation system using machine learning techniques briefly. Introduction You love listening to music right? Imagine hearing your favorite song on any online music platform let’s say Spotify. Suppose that the song’s finished, what now? Yes, the next song gets played automatically. Have you ever imagined, how so?…
- Top 15 Python Libraries For Data Science in 2022Introduction In this informative article, we look at the most important Python Libraries For Data Science and explain how their distinct features may help you develop your data science knowledge. Python has a rich data science library environment. It’s almost impossible to cover everything in a single article. As a consequence, we’ve compiled a list…
- Top 15 Python Libraries For Machine Learning in 2022Introduction In today’s digital environment, artificial intelligence (AI) and machine learning (ML) are getting more and more popular. Because of their growing popularity, machine learning technologies and algorithms should be mastered by IT workers. Specifically, Python machine learning libraries are what we are investigating today. We give individuals a head start on the new year…
- Setup and Run Machine Learning in Visual Studio CodeIn this article, we are going to discuss how we can really run our machine learning in Visual Studio Code. Generally, most machine learning projects are developed as ‘.ipynb’ in Jupyter notebook or Google Collaboratory. However, Visual Studio Code is powerful among programming code editors, and also possesses the facility to run ML or Data…
- Diabetes prediction using Machine LearningIn this article, we are going to build a project on Diabetes Prediction using Machine Learning. Machine Learning is very useful in the medical field to detect many diseases in their early stage. Diabetes prediction is one such Machine Learning model which helps to detect diabetes in humans. Also, we will see how to Deploy…
- 15 Deep Learning Projects for Final yearIntroduction In this tutorial, we are going to learn about Deep Learning Projects for Final year students. It contains all the beginner, intermediate and advanced level project ideas as well as an understanding of what is deep learning and the applications of deep learning. What is Deep Learning? Deep learning is basically the subset of…
- Machine Learning Scenario-Based QuestionsHere, we will be talking about some popular Data Science and Machine Learning Scenario-Based Questions that must be covered while preparing for the interview. We have tried to select the best scenario-based machine learning interview questions which should help our readers in the best ways. Let’s start, Question 1: Assume that you have to achieve…
- Customer Behaviour Analysis – Machine Learning and PythonIntroduction A company runs successfully due to its customers. Understanding the need of customers and fulfilling them through the products is the aim of the company. Most successful businesses achieved the heights by knowing the need of customers and dynamically changing their strategies and development process. Customer Behaviour Analysis is as important as a customer…
- NxNxN Matrix in Python 3A 3d matrix(NxNxN) can be created in Python using lists or NumPy. Numpy provides us with an easier and more efficient way of creating and handling 3d matrices. We will look at the different operations we can provide on a 3d matrix i.e. NxNxN Matrix in Python 3 using NumPy. Create an NxNxN Matrix in…
- 3 V’s of Big dataIn this article, we will explore the 3 V’s of Big data. Big data is one of the most trending topics in the last two decades. It is due to the massive amount of data that has been produced as well as consumed by everyone across the globe. Major evolution in the internet during the…
- Naive Bayes in Machine LearningIn the Machine Learning series, following a bunch of articles, in this article, we are going to learn about the Naive Bayes Algorithm in detail. This algorithm is simple as well as efficient in most cases. Before starting with the algorithm get a quick overview of other machine learning algorithms. What is Naive Bayes? Naive Bayes…
- Automate Data Mining With PythonIntroduction Data mining is one of the most crucial steps in Data Science. To drive meaningful insights from data to take business decisions, it is very important to mine the data. Deleting or ignoring unnecessary and unavailable parts of data and focusing on the correct and right data is beneficial, and more if required in…
- Support Vector Machine(SVM) in Machine LearningIntroduction to Support vector machine In the Machine Learning series, following a bunch of articles, in this article, we are going to learn about Support Vector Machine Algorithm in detail. In most of the tasks machine learning models handle like classifying images, handling large amounts of data, and predicting future values based on current values,…
- Convert ipynb to PythonThis article is all about learning how to Convert ipynb to Python. There is no doubt that Python is the most widely used and acceptable language and the number of different ways one can code in Python is uncountable. One of the most preferred ways is by coding in Jupyter Notebooks. This allows a user…
- Data Science Projects for Final YearDo you plan to complete your data science course this year? If so, one of the criteria for receiving your degree can be a data analytics project. Picking the best Data Science Projects for Final Year might be difficult. Many of them have a high learning curve, which might not be the best option if…
- Multiclass Classification in Machine LearningIntroduction The fact that you’re reading this article is evidence of the fact that you’ve finally realised that classification problems in real life are rarely limited to a binary choice of ‘yes’ and ‘no’, or ‘this’ and ‘that’. If the number of classes that the tuples can be classified into exceeds two, the classification is…
- Movie Recommendation System: with Streamlit and Python-MLHave you come across products on Amazon that is recommended to you or videos on YouTube or how Facebook or LinkedIn recommends new friend/connections? Of course, you must on daily basis. All of these recommendations are nothing but the Machine Learning algorithms forming a system, a recommendation system. Recommendation systems recommend relevant items or content…
- Getting Started with Seaborn: Install, Import, and UsageSeaborn Library in Python Seaborn is a visualization library for plotting good-looking and stylish graphs in Python. It provides different types of styles and color themes to make good-looking graphs. The latest version of the seaborn library is 0.11.2. Installation Mandatory dependencies numpy (>= 1.9.3) scipy (>= 0.14.0) matplotlib (>= 1.4.3) pandas (>= 0.15.2) Importing Seaborn Library Using Seaborn Library…
- List of Machine Learning AlgorithmsIn this article on the list of Machine Learning Algorithms, we are going to learn the top 10 Machine Learning Algorithms that are commonly used and are beginner friendly. We all come across some of the machines in our day-to-day lives as Machine Learning is making our day-to-day life easy from self-driving cars to Amazon virtual assistant “Alexa”….
- Recommendation engine in Machine LearningWhat is a Recommendation System? Recommendation systems or Recommendation engine in Machine Learning is a way of suggesting similar items and ideas to the user’s interests. Recommender systems are widely used on many applications for recommending products and services to users. The goal of a recommender system is to generate meaningful recommendations to a collection…
- Machine Learning Projects for Final YearThe year is 2022. We are all aware of the industry’s constant expansion. Python’s growth in the industry from 2018 to 2021 was over 40%, and it is predicted that this growth will increase to 20% in the upcoming years. In the last few years, the number of Python developers has climbed by 30%, especially…
- ML SystemsWhat is Machine Learning? In this article, we will see learn about ML Systems or Machine Learning Systems. Before learning about ML Systems, let us first understand the term Machine Learning. It is a field of Artificial Intelligence, where humans train the model to learn, analyze and make decisions. Machine Learning is an important part…
- Python Derivative CalculatorIntroduction Today, in this article, we will develop a Python Derivative Calculator, one of the most significant requirements of mathematics and statistics students all the time. Derivatives are also used for solving machine learning optimization problems. In order to move closer and closer to the maximum or minimum of a function, optimization methods such as…
- Mathematics for Machine LearningWhat is Machine Learning? In this article, we will understand how we use Mathematics for Machine learning, but before that, let’s understand What is Machine Learning? Machine Learning is mainly about developing intelligent models that can automatically extract important information and patterns from data and drive actions according to our requirements. Data Science and Machine…
- Data Science Homework Help – Get The Assistance You NeedIntroduction to Data Science Homework Help WhatsApp us for any type of help in your assignment related to machine learning or any other assignment. Do you find it difficult to keep up with your assignments? Do you find it hard to understand the concepts and their applications in data science? Are you struggling to understand…
- How to Ace Your Machine Learning Assignment – A Guide for BeginnersIntroduction to Machine Learning Assignment Help WhatsApp us for any type of help in your assignment related to machine learning or any other assignment. Are you studying machine learning and struggling with your assignment? You’re not alone. Many students struggle with assignments when they first begin a machine learning class, but it’s not impossible. This…
- Top 10 Resources to Find Machine Learning Datasets in 2022Datasets are essential to source the correct information for the work. To source the Machine Learning Datasets datasets, it is first necessary to know where you can get them. You must register for machine learning training for more expertise and knowledge on this topic. This article will discuss the top 10 sources from which you…
- Face recognition PythonIn the Face recognition python article, we are going to build a project using which anyone will be able to detect faces. Have you ever noticed that Facebook automatically tags your friends when you try to upload a group photo? It can identify an individual using their face and this is one of the exciting…
- Hate speech detection with PythonIn this article, let’s build the Hate speech detection project in Python. In the current era of the Internet, it is obvious that almost everyone has social media apps to connect and interact with people around the world. At the same time, social media is a place where a lot of personal opinions have been…


