Seaborn Library in Python
Seaborn is a visualization library for plotting good-looking and stylish graphs in Python. It provides different types of styles and color themes to make good-looking graphs. The latest version of the seaborn library is 0.11.2.
Installation
pip install seabornMandatory dependencies
- numpy (>= 1.9.3)
- scipy (>= 0.14.0)
- matplotlib (>= 1.4.3)
- pandas (>= 0.15.2)
Importing Seaborn Library
import seaborn as sbUsing Seaborn Library for Creating Graphs
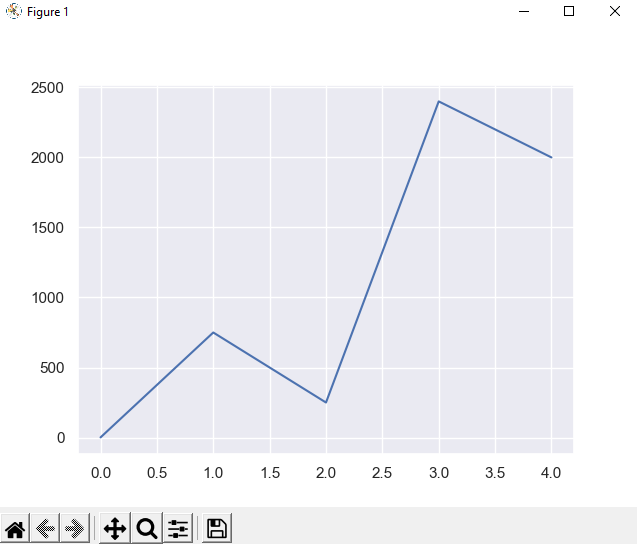
Creating Line Graph
# Importing Seaborn and Matplotlib Library For Graph Plotting
import seaborn as sb
import matplotlib.pyplot as plt

# Setting theme of our Graph using set_theme() function
sb.set_theme(style="darkgrid")

# Creating a List of Data for Graph Plotting
graph_data = [1, 750, 250, 2400, 2000]

# Plotting a Line Graph Using Seaborn Library
sb.lineplot(data = graph_data)

# Showing the plotted graph using show() function of matplolib library
plt.show()
Output:
Creating Scattered Line Graph
# Importing Seaborn Matplotlib and Numpy Library For Graph Plotting
import seaborn as sb
import matplotlib.pyplot as plt
import numpy as np

# Randomising the data to get random x and y co-ordinates for plotting
rs = np.random.RandomState(7)
x = rs.normal(2, 1, 75)
y = 2 + 1.5 * x + rs.normal(0, 2, 75)

# Plotting x and y co-ordinates using residpolt() function
sb.residplot(x=x, y=y)

# Showing the plotted graph using show() function of matplolib library
plt.show()
Output:

Creating BoxPlot Graphs
# Importing Seaborn and Matplotlib Library For Graph Plotting
import seaborn as sb
import matplotlib.pyplot as plt

# Setting the style of our Graph using set() function
sb.set_theme(style="whitegrid")

# Using load_datatset() function to get data for graph plotting
example = sb.load_dataset("tips")

# Plotting a Line Graph Using Seaborn Library
sb.boxplot(x="day", y="total_bill",
            hue="smoker", palette=["m", "g"],
            data=example)
sb.despine(offset=10, trim=True)

# Showing the plotted graph using show() function of matplolib library
plt.show()
Output:

We hope this article on Graph Plotting using Seaborn Library in Python helps you.
Thank you for reading this article, click here to start learning Python in 2022.
Also Read:
- Download 1000+ Projects, All B.Tech & Programming Notes, Job, Resume & Interview Guide, and More – Get Your Ultimate Programming Bundle!
- Music Recommendation System in Machine Learning
- Create your own ChatGPT with Python
- SQLite | CRUD Operations in Python
- Event Management System Project in Python
- Ticket Booking and Management in Python
- Hostel Management System Project in Python
- Sales Management System Project in Python
- Bank Management System Project in C++
- Python Download File from URL | 4 Methods
- Python Programming Examples | Fundamental Programs in Python
- Spell Checker in Python
- Portfolio Management System in Python
- Stickman Game in Python
- Contact Book project in Python
- Loan Management System Project in Python
- Cab Booking System in Python
- Brick Breaker Game in Python
- 100+ Java Projects for Beginners 2023
- Tank game in Python
- GUI Piano in Python
- Ludo Game in Python
- Rock Paper Scissors Game in Python
- Snake and Ladder Game in Python
- Puzzle Game in Python
- Medical Store Management System Project in Python
- Creating Dino Game in Python
- Tic Tac Toe Game in Python
- Courier Tracking System in HTML CSS and JS
- Test Typing Speed using Python App