By now you have a good grasp of how you can solve both classification and regression problems by using Linear and Logistic Regression. But in Logistic Regression the way we do multiclass classification is a bit weird since we had to train multiple classifiers instead, we should only use one classifier to do all the work and not just that, logistic regression is a linear classifier i.e. the decision boundary created will be a line but that rarely happens. Decision Tree comes to our rescue here. They are non-linear classifiers that are capable of multiclass classification and boy are they good at it. We’ll learn how they work and how we can use them for classification.
Some Dreaded Terminology
- Root Node: The topmost node of the tree, as seen in the orange block above.
- Leaf Node: The nodes which don’t split further, as seen in the green blocks. These nodes hold a class label in them decided by the majority.
- Internal Node: The nodes that further split into sub-nodes, as seen in blue blocks.
- Splitting: Dividing the target samples based on the feature it’s being split on.
Decision Tree Intuition
So let’s assume that we work in an ice cream factory and you need to find a way to increase customer satisfaction so you take out your truck filled with ice creams and distributed them among people and checked if they like it. Let’s say you need to check the response of people based on the fact whether the ice cream has chocolate or not.

So you had 52 satisfied people and 50 unsatisfied people. When you create the above decision tree you found that people are more satisfied when you have chocolate in ice cream and less satisfied when you don’t have chocolate in ice cream. But what about those 2 people who were unsatisfied with even the chocolate ice cream? We can try and see other variables to split further or we can ignore and say that since the majority is satisfied they’ll be satisfied too and assign that node Satisfied label and the other one Not Satisfied Label. This is the most basic decision tree possible i.e. with a single split.
But chocolate alone isn’t the best measure of satisfaction. We have quantity too. But now we’ll have 2 options for splitting the root node i.e. split on has chocolate? and Quantity. How do we find which feature gives us a better split? But before that how do we define a better split? For that, we calculate the Gini Index for the leaves of split on that feature and the feature with the least Gini index gives the best split. For k classes, Gini Index is calculated as follows:-

pi is the probability of the class for the node. Lower the Gini Index better the split. We then proceed to find the split for each node and create the decision tree.
Types of Decision Tree
- ID3: Iterative Dichotomiser 3. ID3 is mostly used for classification tasks. For the splitting process, ID3 uses the Information Gain to find the better split.
- CART: Classification And Regression Trees. In the case of Classification Trees, the CART algorithm uses a metric called Gini Index to find the better splits. In the case of Regression Trees, the CART algorithm looks for splits that minimize the Least Square Deviation (LSD), choosing the partitions that minimize the result over all possible options.
- CHAID: Chi-squared Automatic Interaction Detection. CHAID relies on the Chi-square independence tests to determine the best split at each step. It chooses the independent variable that has the strongest interaction with the dependent variable.
- C4.5: C4.5 is the successor of ID3 and it can handle both categorical and continuous data. It can be used for building both classification and regression trees. C4.5 uses the Gain Ratio to find a better split. Another capability of C4.5 is that it can prune DTs.
- MARS: Multivariate Adaptive Regression Spline. MARS is used for regression tasks.
Decision Tree Working
Now that we are familiar with the intuition behind decision trees let’s understand the full working of how decision trees are made and how they calculate the Gini index to find the best split. So Let’s take the following dataset as an example:-
| Temperature | Humidity | Wind | Play Tennis? |
| Hot | High | Weak | No |
| Hot | High | Strong | No |
| Hot | High | Weak | Yes |
| Cold | Normal | Weak | Yes |
| Cold | Normal | Strong | No |
| Cold | Normal | Strong | Yes |
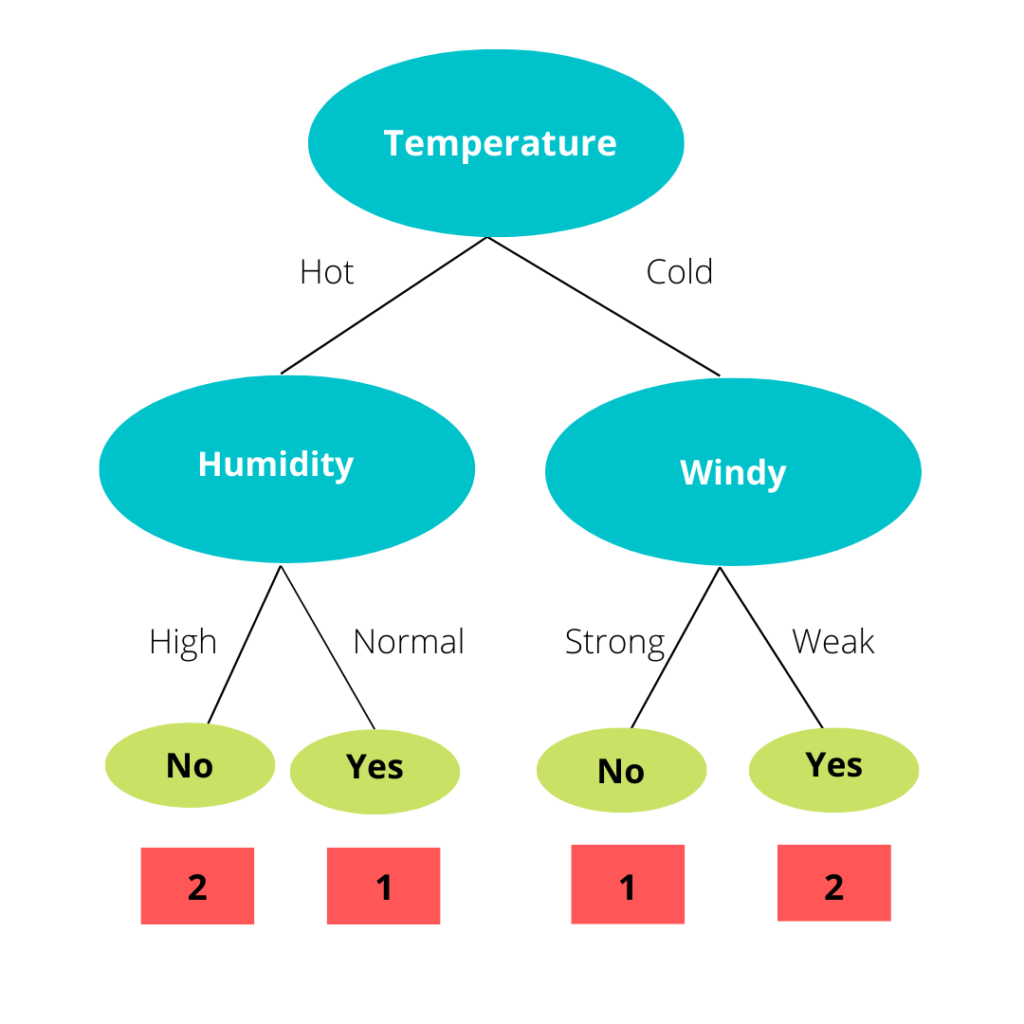
So let’s start by calculating the Gini Index for the split on Temperature. If we split on the Temperature feature we’ll get the following tree.

So to explain a split a bit when we see the temperature column we can see that for the value hot we have 1 Yes and 2 No in Play Tennis so when we split we can say that if the temperature is hot then the block has 1 Yes and 2 No rows from the training dataset. This is the same for Mild and Cold too. Now let’s calculate the Gini index of the leaf nodes.
Now that we’ve calculated the Gini Index for all the leaf nodes we can calculate the Total Gini Index for the Temperature, but we can’t just add them all to do so since all the leaf nodes don’t have the same amount of elements. For example, the leaf node for hot has 1 yes and 2 no i.e. 3 elements. So instead of adding them, we’ll calculate their weighted average.
Now that we’ve calculated the Gini Index for Temperature we’ll follow the same steps and calculate the Gini index for humidity and wind.
Now that we’ve calculated Gini Index for all the features we can see that Temperature has the least Gini Index hence we’ll use it for the split. We’ll repeat the process and find the best split for the leaf nodes and if there is a case where Gini before the split is lesser then we won’t split in that case and make it the leaf node with the class label as the majority class.
Note: Gini Index for Pure leaf nodes is 0.
Splitting for Continuous Value
In the section above we saw how we can do splitting on the categorical feature but in the numerical feature with the continuous value, the scenario is a bit different assuming there are n continuous values in a column we can create n splits of that node. For example:-
| Area of House | Loan Approved? |
| 2 | Yes |
| 1.2 | Yes |
| 8.6 | No |
| 6 | No |
| 12.2 | Yes |
Now in order to make a split based on the Area of the House, we’ll start by sorting the data and finding the mid-point between them. Once we have our midpoints we’ll calculate Gini Index for all of them and use the one with the least Gini Index for the split condition. But what is the split based on? It’s a binary split based on <x where x is one of the midpoints.
We’ve seen how we can use Gini Index to find the best split but there are other metrics that we can use to calculate the impurity to find the best feature for splitting, let’s take a look at a few of them:-
Entropy
Entropy, simply put, is the measure of randomness in the data.

Information Gain
Information gain is the reduction in entropy after the split.

Gain Ratio
The gain ratio is the ratio of information gain and split info.

Implementation of Decision Tree using sklearn
Decision Tree is present in sklearn under the tree. We’ll use the famous iris dataset present in sklearn, in that dataset is a dictionary with features matrix under key data and target vector under key target. So let’s start by loading the data.
#Loading the dataset
from sklearn.datasets import load_iris
cancer = load_iris()
X = cancer.data
Y = cancer.target
In order to determine if our model performs well on data other than training data, we can split our data into two parts, one that we’ll use to train our model called training data, and one that we’ll use to test the performance of our model called testing data. train_test_split does exactly that we give it our data and test_size i.e. ratio of data to be used as test data.
#Importing train_test_split method
from sklearn.model_selection import train_test_split

#Splitting the train and test data
x_train, x_test, y_train, y_test = train_test_split(X,Y, test_size = 0.3)
Now that we have our training and testing data let’s create our DecisionTreeClassifier object and train it on the training data. To train the data we use the fit() method like always. Let’s do it.
#importing the DecisionTreeClassifier class
from sklearn.tree import DecisionTreeClassifier

#Loading the data into the model
clf = DecisionTreeClassifier()
clf.fit(x_train, y_train)
Note that if you wanna solve a regression problem with a Decision Tree you can use DecisionTreeRegressor. Now let’s check how accurate the model is by finding the accuracy score for the testing dataset. For this model, it came out to be 0.955 meaning that about 95.5% of predictions were correct.
#Importing accuracy_score method
from sklearn.metrics import accuracy_score

#Calculating the accuracy score
print(accuracy_score(y_test,clf.predict(x_test)))
Since this is a simple dataset it gave a high accuracy for testing data but Decision Trees tend to overfit thus it might happen that you have a high training accuracy and bad testing accuracy for a more complex dataset. But now that we have come this far let me introduce you to Confusion Matrix. I know the names just keep getting weird but please bear with me.
A confusion Matrix or Error Matrix is a matrix that tells how our model performed, let’s create a confusion matrix for our classifier. You can find confusion_matrix in sklearn. metrics.
#Confusion matrix
from sklearn.metrics import confusion_matrix
print(confusion_matrix(y_test,clf.predict(x_test)))

Reading a confusion matrix is a simple element (0,0) that tells how many samples were predicted correctly as class 0, element (1,1) tells how many samples were predicted correctly as class 1, and so on. Now element (0,1) tells how many samples were predicted as class 0 but were actually class 1 and element (1,0) tells how many samples were predicted as class 1 but were actually class 0. If the target has n classes then the confusion matrix will be of shape n*n.
Advantages of Decision tree algorithm
- Doesn’t require scaling or normalization of data.
- The model is very intuitive and easy to explain.
- Not affected by missing values.
Disadvantages Decision tree algorithm
- A small change in the data can cause a large change in the structure of the decision tree causing instability.
- Computationally Expensive.
- Finding the best tree is an NP-Hard problem.
- Very Prone to overfitting.
Try this video:
Source: Statquest with Josh Starmer
Thanks for reading
Hope you enjoyed learning and got what you need.
Comment if you have any queries or if you found something wrong in this article.
- Flower classification using CNNYou know how machine learning is developing and emerging daily to provide efficient and hurdle-free solutions to day-to-day problems. It covers all possible solutions, from building recommendation systems to predicting something. In this article, we are discussing one such machine-learning classification application i.e. Flower classification using CNN. We all come across a number of flowers…
- Music Recommendation System in Machine LearningIn this article, we are discussing a music recommendation system using machine learning techniques briefly. Introduction You love listening to music right? Imagine hearing your favorite song on any online music platform let’s say Spotify. Suppose that the song’s finished, what now? Yes, the next song gets played automatically. Have you ever imagined, how so?…
- Top 15 Python Libraries For Data Science in 2022Introduction In this informative article, we look at the most important Python Libraries For Data Science and explain how their distinct features may help you develop your data science knowledge. Python has a rich data science library environment. It’s almost impossible to cover everything in a single article. As a consequence, we’ve compiled a list…
- Top 15 Python Libraries For Machine Learning in 2022Introduction In today’s digital environment, artificial intelligence (AI) and machine learning (ML) are getting more and more popular. Because of their growing popularity, machine learning technologies and algorithms should be mastered by IT workers. Specifically, Python machine learning libraries are what we are investigating today. We give individuals a head start on the new year…
- Setup and Run Machine Learning in Visual Studio CodeIn this article, we are going to discuss how we can really run our machine learning in Visual Studio Code. Generally, most machine learning projects are developed as ‘.ipynb’ in Jupyter notebook or Google Collaboratory. However, Visual Studio Code is powerful among programming code editors, and also possesses the facility to run ML or Data…
- Diabetes prediction using Machine LearningIn this article, we are going to build a project on Diabetes Prediction using Machine Learning. Machine Learning is very useful in the medical field to detect many diseases in their early stage. Diabetes prediction is one such Machine Learning model which helps to detect diabetes in humans. Also, we will see how to Deploy…
- 15 Deep Learning Projects for Final yearIntroduction In this tutorial, we are going to learn about Deep Learning Projects for Final year students. It contains all the beginner, intermediate and advanced level project ideas as well as an understanding of what is deep learning and the applications of deep learning. What is Deep Learning? Deep learning is basically the subset of…
- Machine Learning Scenario-Based QuestionsHere, we will be talking about some popular Data Science and Machine Learning Scenario-Based Questions that must be covered while preparing for the interview. We have tried to select the best scenario-based machine learning interview questions which should help our readers in the best ways. Let’s start, Question 1: Assume that you have to achieve…
- Customer Behaviour Analysis – Machine Learning and PythonIntroduction A company runs successfully due to its customers. Understanding the need of customers and fulfilling them through the products is the aim of the company. Most successful businesses achieved the heights by knowing the need of customers and dynamically changing their strategies and development process. Customer Behaviour Analysis is as important as a customer…
- NxNxN Matrix in Python 3A 3d matrix(NxNxN) can be created in Python using lists or NumPy. Numpy provides us with an easier and more efficient way of creating and handling 3d matrices. We will look at the different operations we can provide on a 3d matrix i.e. NxNxN Matrix in Python 3 using NumPy. Create an NxNxN Matrix in…
- 3 V’s of Big dataIn this article, we will explore the 3 V’s of Big data. Big data is one of the most trending topics in the last two decades. It is due to the massive amount of data that has been produced as well as consumed by everyone across the globe. Major evolution in the internet during the…
- Naive Bayes in Machine LearningIn the Machine Learning series, following a bunch of articles, in this article, we are going to learn about the Naive Bayes Algorithm in detail. This algorithm is simple as well as efficient in most cases. Before starting with the algorithm get a quick overview of other machine learning algorithms. What is Naive Bayes? Naive Bayes…
- Automate Data Mining With PythonIntroduction Data mining is one of the most crucial steps in Data Science. To drive meaningful insights from data to take business decisions, it is very important to mine the data. Deleting or ignoring unnecessary and unavailable parts of data and focusing on the correct and right data is beneficial, and more if required in…
- Support Vector Machine(SVM) in Machine LearningIntroduction to Support vector machine In the Machine Learning series, following a bunch of articles, in this article, we are going to learn about Support Vector Machine Algorithm in detail. In most of the tasks machine learning models handle like classifying images, handling large amounts of data, and predicting future values based on current values,…
- Convert ipynb to PythonThis article is all about learning how to Convert ipynb to Python. There is no doubt that Python is the most widely used and acceptable language and the number of different ways one can code in Python is uncountable. One of the most preferred ways is by coding in Jupyter Notebooks. This allows a user…
- Data Science Projects for Final YearDo you plan to complete your data science course this year? If so, one of the criteria for receiving your degree can be a data analytics project. Picking the best Data Science Projects for Final Year might be difficult. Many of them have a high learning curve, which might not be the best option if…
- Multiclass Classification in Machine LearningIntroduction The fact that you’re reading this article is evidence of the fact that you’ve finally realised that classification problems in real life are rarely limited to a binary choice of ‘yes’ and ‘no’, or ‘this’ and ‘that’. If the number of classes that the tuples can be classified into exceeds two, the classification is…
